Typical Project: Data Cleansing & Modeling take significant Time
VERIFY
Initial phase where we determine the project’s scope and requirements, ensuring alignment with objectives and anticipated outcomes.
INTEGRATE
Data is sourced and extracted from various systems, laying the foundation for further processing.
STRUCTURE
The core phase of the project and requires the steps outlined the section to the right.
Environment Selection
Identifying the optimal environment for data processing and modeling. Example: Deciding between Microsoft Azure cloud services for scalable data solutions or on-premises configurations using Microsoft’s SQL Server. Consideration is also given to the integration of Python scripts for advanced data manipulations and computations.
System Architecture
Designing a robust system framework that can handle the project’s requirements. Example: Setting up an architecture that employs Azure Data Factory for ETL tasks, with Python scripts enhancing data transformations. Integration with Azure Stream Analytics may be used for real-time event processing.
Data Architecture
Structuring data in a manner that facilitates analysis and decision-making. Example: Organizing data using SQL Server in a structured format to support OLAP operations and utilizing Python libraries like Pandas for advanced data wrangling. Once structured, data can be visualized and reported on using tools like Power BI, or Dash Enterprise.
ARCHITECTURE
This is the most involved phase.
Environment Selection
A feature that allows businesses to integrate their business with more various marketing channels
Environment Selection
A feature that allows businesses to integrate their business with more various marketing channels
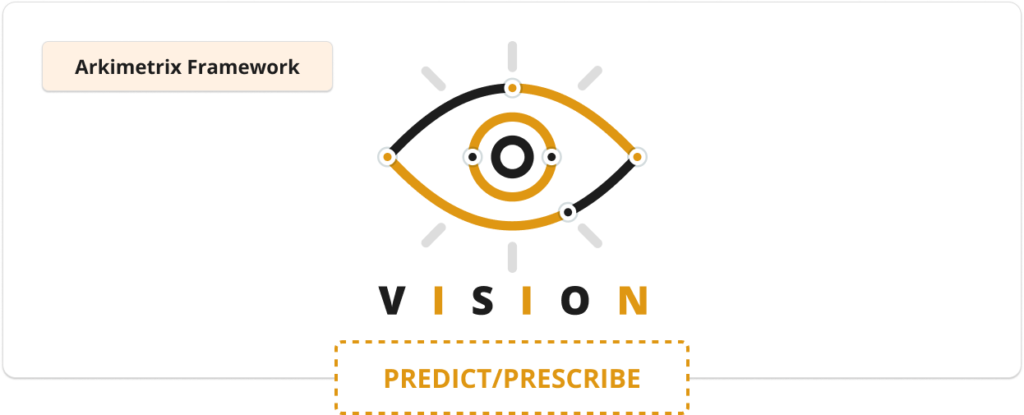
V
I
S
I
O
N
We follow the Arkimetrix Semantic
Guide, a Distillation of Experience
ILLUSTRATE & ORGANIZE
Story telling with data is an art and we have created an internal “Semantic Guide” to standardize
Keep It Simple: Easy to understand and interpret
Consider Users cognitive style: Cater to individual visual/verbal processing
Choose the right chart or table: Best represents the data and easiest to interpret
Label everything: Axes, legends. and titles, should be clearly labeled
Use color effectively: Used purposefully, highlight important points or trends
Design for interactivity: Allow users to interact with the data: filters, hover-over
Test and iterate: User feedback to iterate and Improve the design
V
I
S
I
O
N
Creating Portals, Sharing data files & Automated Reports
Narrate
Arkimetrix VISION: Concluding with Narration that Transforms Analysis into Action
Articulate the results of the analysis to stakeholders, ensuring clarity and understanding.
Articulate the results of the analysis to stakeholders, ensuring clarity and understanding.
Or it can be described as 'Synthesis'
Synthesize the results of the analysis
Create a coherent and actionable set of recommendations
Identify the key insights and distill into a set of concrete actions
Arkimetrix VISION Methodology
is the baseline for Predict & Prescribe Stages
Scroll to Top
Get in touch!
We’d love to hear from you. Use the form below to drop us an email, or you can always call us. North America Toll-free +1 (800) 701-4342